Data Governance Series | Article 18 of 20
Governing the Information That Drives the Enterprise
Summary
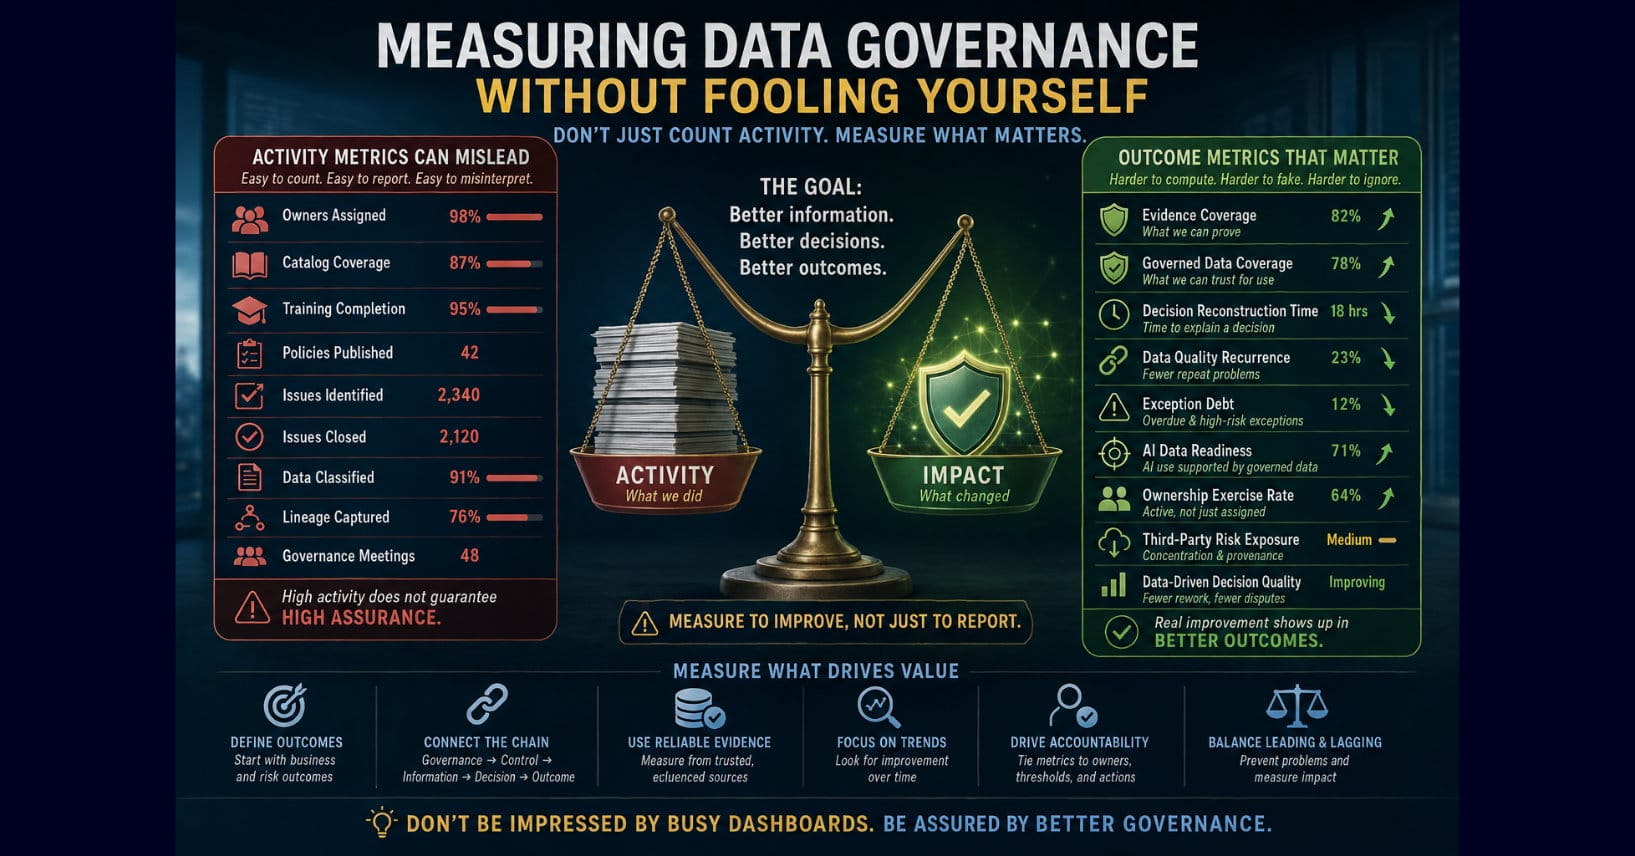
Data governance programs generate abundant metrics: owners assigned, catalog coverage, training completion, policies published, issues closed, data classified, and governance meetings held. Every number can be accurate while still giving leadership the wrong impression about governance effectiveness.
“Measuring Data Governance Without Fooling Yourself” examines the difference between measuring governance activity and measuring governance outcomes. It argues that organizations should connect governance to controls, information state, decisions, and business outcomes rather than relying primarily on administrative completion metrics.
The article explores ownership exercise rates, evidence coverage and freshness, quality recurrence, prevention, exception debt, governance drift, decision latency, reconciliation effort, authoritative-source adoption, third-party dependency, AI data readiness, governed data coverage, and decision reconstruction. It also examines the limitations of composite maturity scores, traffic-light dashboards, issue-closure rates, and training metrics.
The central principle is straightforward: measurement should reveal whether governance is making enterprise information more trustworthy, decisions more defensible, risks more controlled, and outcomes measurably better—not merely whether the governance program is busy.
Data governance programs love metrics.
Percentage of data cataloged.
Percentage of critical data elements with owners.
Number of data quality rules.
Number of issues identified.
Number of issues closed.
Percentage of employees trained.
Number of policies published.
Number of governance meetings held.
Percentage of data classified.
Number of datasets with lineage.
These numbers are easy to put on a dashboard.
They are easy to trend.
They are easy to present to leadership.
They can also create a remarkably convincing illusion of progress.
A data governance program can improve every one of those metrics while the enterprise continues making decisions with unreliable, poorly understood, inadequately governed information.
That is the measurement problem.
The question is not whether governance activity is increasing.
The question is whether governance is making the enterprise better at trusting, controlling, using, and making decisions from its data.
Those are not the same thing.
The Dashboard Can Lie Without Containing a Single False Number
This is what makes governance measurement difficult.
The metrics may all be accurate.
Ninety-eight percent of critical data has an assigned owner.
True.
Ninety-five percent of required employees completed governance training.
True.
Eighty-seven percent of critical datasets are cataloged.
True.
Data quality issues closed increased 34 percent.
True.
Every number can be factually correct.
The overall conclusion can still be wrong.
Why?
Because the metrics may describe governance activity rather than governance effectiveness.
The dashboard is not lying.
The interpretation is.
Activity Is Not Outcome
Governance programs naturally generate activity.
Committees meet.
Policies are written.
Owners are assigned.
Catalogs are populated.
Issues are logged.
Training is delivered.
Controls are configured.
Assessments are completed.
Those activities matter.
But activity metrics answer:
“What did the governance program do?”
Leadership needs another question answered:
“What changed because governance did it?”
Did data become more trustworthy?
Did decision latency decline?
Did recurring quality problems decrease?
Did ownership become clearer?
Did exceptions become more controlled?
Did unauthorized use decrease?
Did obsolete data stop influencing current decisions?
Did AI systems consume better-governed information?
Did operational risk decline?
Those are effectiveness questions.
Start With the Outcome
A useful measurement discipline begins by asking what data governance is supposed to accomplish.
Not what the governance office does.
What the enterprise needs.
For example:
trusted information;
clear accountability;
reliable decision-making;
appropriate data use;
regulatory compliance;
reduced operational risk;
faster issue resolution;
controlled AI adoption;
defensible decisions;
and improved business performance.
Then work backward.
If the desired outcome is trusted information, what would demonstrate that trust is improving?
If the desired outcome is accountability, what evidence would show that owners are actually exercising authority?
If the desired outcome is reduced data risk, what would show that consequential failures are becoming less likely or less severe?
Metrics should connect governance activity to enterprise consequence.
Measure the Chain, Not Just the Program
A useful model is:
Governance → Control → Information State → Decision → Outcome
For example:
Ownership governance establishes accountability.
The owner approves quality thresholds.
Quality controls operate.
Information quality improves.
Decision-makers spend less time reconciling conflicting numbers.
Decisions happen faster.
That is a governance chain.
If measurement stops at:
Owner Assigned: Yes
we know almost nothing about whether the chain worked.
The farther measurement reaches toward decision and outcome, the more meaningful it becomes.
Ownership Coverage Is a Weak Metric
Consider one of the most common governance metrics:
Percentage of critical data assets with assigned owners.
Suppose the dashboard says 99 percent.
Excellent.
Now ask:
How many owners have reviewed their data during the past quarter?
How many approved quality thresholds?
How many resolved governance issues?
How many accepted or rejected exceptions?
How many reviewed AI uses?
How many made retention decisions?
How many can explain what they are accountable for?
A name in a catalog is not the same as active ownership.
A better measurement might include:
Ownership Assignment Coverage
and
Ownership Exercise Rate
The first tells us whether accountability has been designated.
The second tells us whether accountability is operating.
Measure Ownership Latency
Another useful metric is ownership latency.
When an accountable owner leaves, changes roles, or becomes unavailable, how long does critical data remain without effective ownership?
One day?
Two weeks?
Six months?
Organizations may report 100 percent ownership annually while experiencing long periods of practical orphaning between reviews.
Point-in-time coverage can hide operational gaps.
Time matters.
Catalog Coverage Can Create False Confidence
Catalog coverage is useful.
If only 20 percent of critical enterprise data is cataloged, governance has an obvious visibility problem.
But catalog coverage is a maturity metric, not necessarily an effectiveness metric.
A catalog entry may be:
outdated;
incomplete;
incorrect;
unowned;
poorly classified;
missing provenance;
missing lineage;
or disconnected from operational evidence.
The enterprise can catalog bad governance very efficiently.
Coverage should therefore be paired with measures such as:
metadata completeness;
evidence coverage;
metadata freshness;
ownership activity;
provenance confidence;
and governance-state validity.
Discovery is necessary.
Discovery is not assurance.
Measure Evidence Coverage
Article 17 introduced evidence coverage.
This can become one of the more meaningful governance measures.
For critical data, what percentage has current evidence supporting:
ownership;
quality;
classification;
lineage;
provenance;
retention;
approved use;
third-party dependencies;
AI eligibility;
and significant governance decisions?
A dataset may be cataloged without being evidenced.
That distinction matters.
An evidence coverage metric tells leadership how much of the governance state can actually be demonstrated.
Measure Evidence Freshness
Evidence also ages.
A quality assessment from two years ago may not describe today’s data.
An ownership attestation completed before a reorganization may no longer mean much.
A third-party provenance review performed before a vendor changed methodology may no longer support reliance.
An AI-use approval issued before an application gained new capabilities may no longer reflect the current risk.
Therefore, organizations should measure not merely whether evidence exists but whether it remains current.
For example:
Percentage of critical governance evidence within required validity periods.
That is stronger than:
Evidence exists: Yes.
Data Quality Scores Can Mislead
Data quality dashboards often compress complex conditions into a percentage.
97.4 percent.
Green.
Looks good.
But what does that mean?
Which dimensions?
Accuracy?
Completeness?
Timeliness?
Consistency?
Validity?
Uniqueness?
Which data?
For which purpose?
A 97 percent completeness rate may be excellent for exploratory analytics.
It may be unacceptable for regulatory reporting.
Quality cannot be interpreted independently of consequence.
A mature metric should connect:
Quality State → Use Case → Required Threshold → Consequence
Otherwise, quality scores risk becoming decorative numbers.
Measure Recurrence
One of the strongest indicators of governance effectiveness is whether the same problems keep returning.
Suppose the organization closed 2,000 data quality issues this year.
That sounds productive.
But 1,600 were variations of problems encountered last year.
The organization may be excellent at remediation and poor at governance.
A useful metric is:
Issue Recurrence Rate
How many resolved problems return?
How many originate from the same process?
How many involve the same ownership gap?
How many arise from the same uncontrolled transformation?
Governance should reduce the creation of recurring problems, not merely increase the speed at which they are closed.
Measure Prevention
This suggests another important shift.
Most governance dashboards measure detected failures.
Mature governance should also measure prevented failures.
That is harder.
Prevention leaves fewer visible artifacts.
But evidence can help.
Examples might include:
quality failures stopped before publication;
unauthorized AI uses blocked;
expired data excluded from retrieval;
invalid third-party records rejected;
access requests denied due to purpose restrictions;
automated actions prevented because evidence thresholds were not met;
or superseded policies excluded from RAG.
These events demonstrate controls working before harm occurs.
A governance program that prevents 500 problems may appear less busy than one that resolves 2,000.
It may be much more effective.
Issue Closure Rate Can Reward the Wrong Behavior
Governance teams frequently track issue closure.
Reasonable.
But closure rate can create perverse incentives.
If teams are rewarded for closing issues quickly, they may:
narrow issue scope;
accept weak remediation;
reclassify problems;
close symptoms rather than causes;
or avoid opening difficult issues.
A high closure rate can coexist with persistent governance weakness.
Better measures might include:
time to containment;
time to root-cause resolution;
recurrence after closure;
residual risk;
and effectiveness after remediation.
Closing the ticket is not the same as solving the problem.
Count Exceptions Carefully
The number of governance exceptions is another ambiguous metric.
More exceptions might mean governance is deteriorating.
Or it might mean the organization has become better at identifying and documenting deviations that previously occurred invisibly.
Fewer exceptions might mean stronger compliance.
Or people may simply have stopped reporting them.
Metrics need interpretation.
Useful exception measures may include:
exceptions by risk level;
average age;
percentage expired without remediation;
repeat exceptions;
exceptions by control;
exceptions affecting consequential decisions;
and percentage with documented risk acceptance.
The goal is not necessarily zero exceptions.
It is controlled exceptions.
Measure Exception Debt
Organizations can accumulate exception debt.
Temporary exceptions become permanent.
Expiration dates pass.
Compensating controls disappear.
Owners change.
Nobody revisits the original decision.
The exception remains.
A useful measure is:
Exception Debt
This might include:
number of overdue exceptions;
age of overdue exceptions;
risk concentration;
repeated extensions;
and unresolved remediation obligations.
Exception debt reveals where governance has normalized deviation.
Training Completion Is Not Governance Effectiveness
Training completion is one of the easiest metrics to report.
98 percent completed annual data governance training.
Excellent.
Did behavior change?
Did inappropriate data sharing decrease?
Did classification improve?
Did employees stop submitting sensitive information to unauthorized AI tools?
Did reported issues increase because awareness improved?
Did policy violations decrease?
Completion tells us the training was delivered.
Behavioral measures tell us whether it mattered.
Governance should distinguish education activity from behavioral outcome.
Policy Count Is Almost Meaningless
Another easy metric is the number of policies created or updated.
This may demonstrate administrative progress.
It says little about governance effectiveness.
In fact, increasing policy volume can make governance worse if requirements become:
duplicative;
contradictory;
difficult to understand;
or impossible to operationalize.
A better question is:
What percentage of material policy requirements are connected to operational controls and evidence?
That measures policy execution.
Not policy production.
Measure Control Effectiveness
Controls should be measured according to whether they achieve their intended purpose.
For each material control:
What risk is it intended to reduce?
How often does it execute?
Does it execute successfully?
What failures occur?
How quickly are failures resolved?
Can the control be bypassed?
Does it generate evidence?
Has its effectiveness been tested?
Does the control still address the current risk?
This is particularly important as AI changes data use.
A control designed five years ago may execute perfectly while no longer controlling the relevant risk.
Operational success does not guarantee control relevance.
Measure Governance Drift
Governance drift occurs when the actual operating environment moves away from the governed state.
Examples include:
ownership becomes outdated;
classifications become stale;
new data sources appear;
AI systems consume unapproved data;
vendor methodologies change;
retention rules stop executing;
exceptions expire;
lineage breaks;
quality controls fail silently;
or users create shadow workflows.
Drift metrics can be extremely valuable.
For example:
percentage of critical assets whose actual state differs from approved governance metadata;
number of unauthorized data dependencies detected;
number of AI systems consuming data outside approved scope;
or percentage of governance evidence that has exceeded its validity period.
Governance drift tells leadership whether control is being maintained.
Measure Decision Latency
Article 6 examined the cost of data nobody trusts.
One of those costs is decision latency.
When executives do not trust enterprise data, teams spend time:
reconciling reports;
checking spreadsheets;
validating sources;
calling analysts;
requesting explanations;
and rebuilding numbers.
Governance should reduce that friction.
Organizations might measure:
time required to produce trusted management information;
time spent reconciling conflicting data;
number of manual validation steps before consequential decisions;
or time from information request to decision readiness.
If governance is improving trust, decision friction should eventually decline.
Measure Reconciliation Work
Reconciliation is one of the hidden taxes of poor governance.
Employees may spend thousands of hours comparing:
reports;
systems;
spreadsheets;
vendor feeds;
and departmental calculations.
That labor often appears as normal work.
It is frequently governance debt.
A useful measure might be:
Hours spent reconciling conflicting enterprise information.
Reducing that number can translate governance into economic value.
That is a metric executives understand.
Measure Trust Carefully
Organizations sometimes survey employees about whether they trust data.
That can be useful.
Trust, however, is contextual.
People may trust Finance data and distrust Sales data.
They may trust historical reporting but not forecasts.
They may trust a dashboard for operational decisions but not regulatory reporting.
Trust should therefore be measured at meaningful levels.
Examples:
percentage of critical decisions using designated authoritative sources;
percentage of executive reports requiring manual reconciliation;
frequency of data-source challenges;
or user confidence in specific critical information products.
Trust should be connected to behavior.
Measure Authoritative-Source Adoption
If the organization has designated authoritative sources, are people actually using them?
This can be measured.
For critical information domains:
What percentage of reporting uses the designated authoritative source?
How often are shadow datasets used instead?
How often do AI systems retrieve non-authoritative copies?
How many competing versions remain active?
An authoritative source nobody uses does not solve the trust problem.
Governance needs adoption.
Measure Third-Party Data Dependency
Article 15 established that third-party data remains the enterprise’s governance problem.
Measurement should reflect that dependency.
Useful indicators include:
percentage of consequential decisions dependent upon third-party data;
percentage of critical external datasets with verified provenance;
quality incidents attributable to external sources;
correction propagation time;
single-provider concentration;
vendor methodology changes;
and third-party data consumed by AI.
This reveals external information dependency as an enterprise risk.
Measure AI Data Readiness
AI governance introduces another measurement domain.
Instead of asking only how many AI systems have been inventoried or approved, ask:
What percentage of the data they consume is governed sufficiently for the use?
This is AI data readiness.
Potential measures include:
ownership coverage;
provenance coverage;
quality evidence;
classification;
AI-use permissions;
lifecycle status;
lineage;
third-party transparency;
and machine-generated-data labeling.
An AI system can pass governance review while its information environment remains poorly governed.
AI data readiness exposes that gap.
Measure Governed Data Coverage
A related metric is governed data coverage.
For consequential business and AI systems, what percentage of consumed information meets the governance requirements appropriate to the use?
Not all enterprise data needs maximum governance.
But high-consequence uses should rely upon appropriately governed information.
Governed data coverage connects data governance to actual consumption rather than catalog inventory.
That is a stronger measure.
Measure Decision Evidence
If consequential decisions should be reconstructable, measure that capability.
For example:
percentage of high-consequence data-driven decisions with sufficient evidence to reconstruct:
the information used;
its provenance;
its quality state;
the applicable policy;
active exceptions;
decision authority;
approval;
and resulting action.
This becomes a decision evidence coverage metric.
The organization can then test it.
Select a sample of decisions.
Attempt reconstruction.
How long does it take?
What evidence is missing?
That is much more informative than asking whether the organization has a governance policy.
Measure Time to Reconstruct
A particularly practical metric is:
Time to Reconstruct a Consequential Decision
If a regulator, auditor, executive, or incident investigator asks why a decision occurred, how long does it take to assemble the evidence?
Minutes?
Hours?
Days?
Weeks?
The answer reveals how fragmented governance evidence is.
An evidence-driven enterprise should reduce reconstruction time.
Beware Composite Maturity Scores
Organizations love maturity scores.
3.7 out of 5.
72 percent mature.
Level 4 governance.
These can help summarize complexity.
They can also hide it.
A single score can average together:
excellent ownership;
poor lineage;
strong policy;
weak evidence;
good quality;
and uncontrolled AI use.
The average may look respectable.
The risk may not be.
Composite scores should always be decomposable.
Leadership should be able to see what drives the number.
Red, Yellow, Green Can Hide Risk
Traffic-light dashboards create similar problems.
Green feels safe.
But a green metric may represent:
threshold met;
assessment completed;
owner assigned;
or no incident reported.
Those are different claims.
Every status indicator should answer:
Green according to what?
Measured how?
As of when?
Against which threshold?
Supported by what evidence?
Otherwise, color becomes decoration.
Trend Direction Matters More Than Point Estimates
A single metric provides limited insight.
Trend matters.
Is ownership exercise improving?
Is recurrence declining?
Is evidence coverage increasing?
Is exception debt shrinking?
Is reconciliation effort falling?
Is decision reconstruction becoming faster?
Is AI consuming a higher percentage of governed information?
Governance maturity should produce directional improvement.
The trend can be more informative than the absolute number.
Leading and Lagging Indicators Both Matter
Governance needs both leading and lagging indicators.
Leading indicators may include:
ownership attestations;
quality-control coverage;
evidence freshness;
policy-control mapping;
AI data readiness;
exception aging;
and governance drift.
They indicate conditions that may influence future outcomes.
Lagging indicators may include:
data-related incidents;
regulatory findings;
decision errors;
customer impact;
financial losses;
rework;
and operational disruption.
Leading indicators help prevent.
Lagging indicators show what happened.
A mature dashboard needs both.
Metrics Should Trigger Decisions
A governance metric that nobody acts upon has limited value.
Every significant metric should have:
an owner;
a threshold;
an interpretation;
an escalation path;
and an expected decision.
If evidence coverage falls below 90 percent, what happens?
If exception debt increases 20 percent, who responds?
If a critical dataset fails its quality threshold, does automation stop?
If AI data readiness drops, is deployment restricted?
Metrics become governance when they trigger accountable decisions.
Otherwise, they are reporting.
Measure Fewer Things Better
The temptation is to create dozens or hundreds of metrics.
That usually creates noise.
A board does not need 70 data governance indicators.
Executives do not need a catalog operations dashboard.
They need a concise view of whether governance is improving enterprise control and information trust.
A useful executive dashboard might focus on:
governed data coverage;
active ownership;
material quality risk;
evidence coverage;
exception debt;
governance drift;
AI data readiness;
third-party dependency risk;
decision reconstruction capability;
and data-related business impact.
The exact measures will vary by organization.
The principle is consistency.
Measure what indicates governance effectiveness, not what happens to be easiest to count.
Ask What Behavior the Metric Encourages
Every metric changes behavior.
If teams are measured on catalog entries, they create catalog entries.
If they are measured on issue closure, they close issues.
If they are measured on training completion, they complete training.
That is not necessarily bad.
But leadership should ask:
What behavior will this metric produce?
A poorly designed metric can make the dashboard improve while governance deteriorates.
Measurement is itself a governance mechanism.
Treat it accordingly.
Evidence Protects Measurement Integrity
Article 16 argued that governance needs evidence.
The same applies to governance metrics.
Where did the number come from?
Which systems generated it?
What definition was used?
What time period?
What exclusions?
What transformations?
Who owns the metric?
Can it be reproduced?
Has the definition changed?
A governance dashboard built on poorly governed metrics is an irony the enterprise should avoid.
The measurements themselves need lineage, definitions, ownership, and evidence.
Boardroom Takeaway
Executives should be skeptical of governance dashboards that primarily report:
policies published;
owners assigned;
catalog entries created;
training completed;
issues closed;
or meetings held.
Those measures may indicate progress.
They do not demonstrate effectiveness.
Leadership should ask:
“What has become measurably better because of our data governance program?”
Is information more trustworthy?
Are recurring problems declining?
Are decisions faster?
Are exceptions controlled?
Is evidence stronger?
Is AI consuming better-governed data?
Can consequential decisions be reconstructed more quickly?
Are data-related losses and disruptions decreasing?
The purpose of measurement is not to make governance look mature.
It is to reveal whether governance actually is mature.
Because the most dangerous dashboard is not the one containing bad numbers.
It is the one containing perfectly accurate numbers that cause leadership to reach the wrong conclusion.
Coming Next
Article 19: The Data-Ready Enterprise
A data-ready enterprise is not simply an organization with a modern data platform, a large catalog, sophisticated analytics, or extensive AI investments.
It is an organization whose information can be reliably discovered, understood, trusted, governed, traced, protected, and used for consequential decisions without requiring extraordinary manual effort every time.
The next article brings the series together at the enterprise level and examines what it actually means for an organization—not merely its technology—to be ready to operate on data.